CASOON Open Source
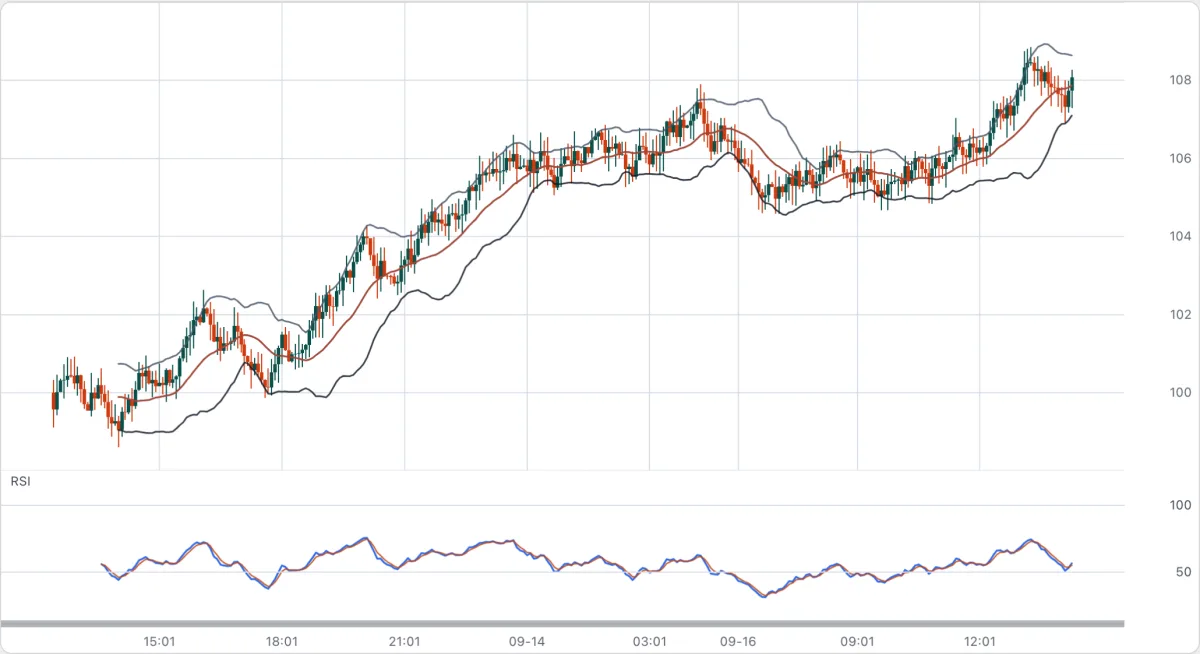
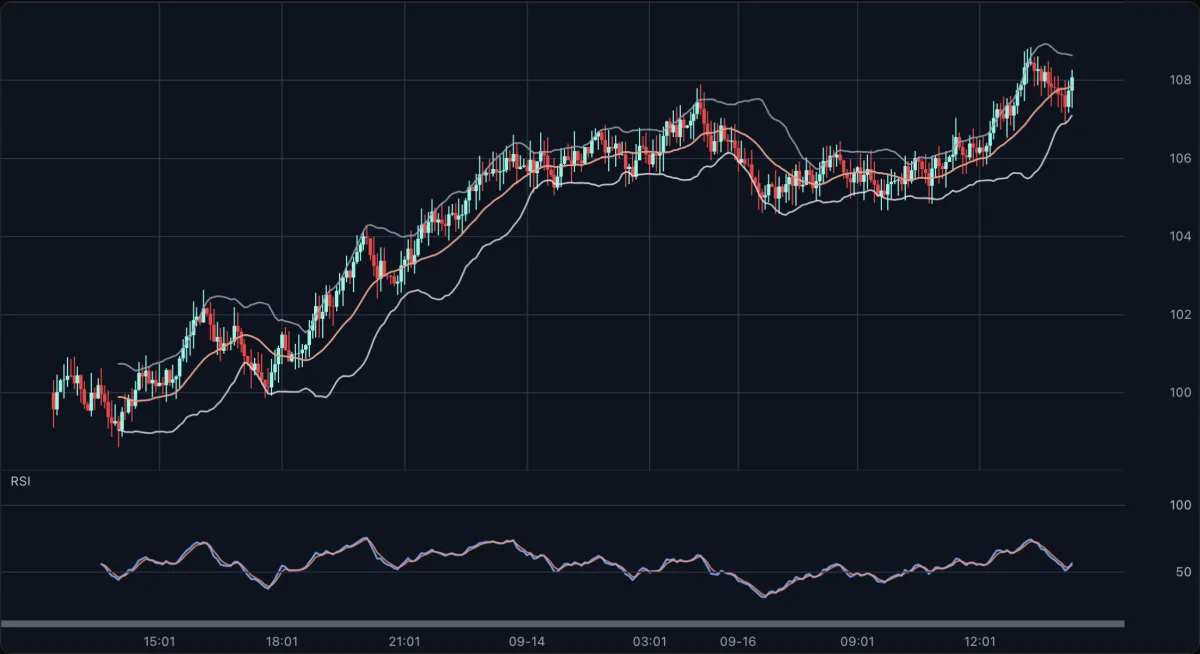
Trading charts in the browser, drawn by Rust. kestrel-loom puts an interactive candlestick chart on a canvas: zoom, pan, indicators, drawing tools. For web and desktop apps that show market data and would rather embed a chart than build one.
BUSL-1.1 alpha v0.1.0 not on crates.io / npm
Open the live demo
indicators from kestrel-chartkit, reported by the WASM build 105
chart types, from candlestick to Renko and footprint 8
drawing tools, with snapping and undo/redo 7
scenes compared command by command in the tests 4 What it does 01 Every indicator, live All indicators of kestrel-chartkit, updated bar by bar as new data arrives. Bands and averages draw over the price, oscillators such as RSI or MACD get their own pane.
02 Weekends without gaps Bars sit side by side, so a trading pause over the weekend takes the width of one bar instead of two empty days.
03 Feels right under the fingers Mouse wheel, trackpad and pinch are told apart: smooth zoom, panning in both directions, a glide after you let go, and a time scrollbar to grab.
04 One file to embed A small JavaScript wrapper takes a canvas and handles sizing, input and redrawing. The chart only draws when something changed.
How it works The chart lives in plain Rust: state, viewport, panes, tools and the render loop. That core knows no browser; it writes drawing commands, and a thin WebAssembly layer carries them out on the canvas. The indicator math comes from kestrel-chartkit , so neither project maintains the other's half.
From your page to the canvas Your page hands candles and input to the JavaScript wrapper. Through the WebAssembly façade they reach the Rust core, which keeps chart state, viewport and tools and takes its indicators from kestrel-chartkit. A render pass produces drawing commands, and the WASM crate executes them on a Canvas 2D context. From your page to the canvas Your page → kestrel-loom.js kestrel-loom.js → kestrel-loom: WASM façade kestrel-chartkit → kestrel-loom: on_bar kestrel-loom → kestrel-loom-wasm: RenderCommands kestrel-loom-wasm → <canvas> WASM façade on_bar RenderCommands Your page – candles, mouse, touch Your page candles, mouse, touch kestrel-loom.js – wrapper you embed kestrel-loom.js wrapper you embed kestrel-loom – Rust core, no browser API kestrel-loom Rust core, no browser API kestrel-chartkit – indicator math kestrel-chartkit indicator math kestrel-loom-wasm – Canvas 2D execution kestrel-loom-wasm Canvas 2D execution <canvas> – the chart <canvas> the chart From your page to the canvas Your page hands candles and input to the JavaScript wrapper. Through the WebAssembly façade they reach the Rust core, which keeps chart state, viewport and tools and takes its indicators from kestrel-chartkit. A render pass produces drawing commands, and the WASM crate executes them on a Canvas 2D context. From your page to the canvas Your page → kestrel-loom.js kestrel-loom.js → kestrel-loom: WASM façade kestrel-chartkit → kestrel-loom: on_bar kestrel-loom → kestrel-loom-wasm: RenderCommands kestrel-loom-wasm → <canvas> WASM façade on_bar RenderCommands Your page – candles, mouse, touch Your page candles, mouse, touch kestrel-loom.js – wrapper you embed kestrel-loom.js wrapper you embed kestrel-loom – Rust core, no browser API kestrel-loom Rust core, no browser API kestrel-chartkit – indicator math kestrel-chartkit indicator math kestrel-loom-wasm – Canvas 2D execution kestrel-loom-wasm Canvas 2D execution <canvas> – the chart <canvas> the chart From your page to the canvas Your page hands candles and input to the JavaScript wrapper. Through the WebAssembly façade they reach the Rust core, which keeps chart state, viewport and tools and takes its indicators from kestrel-chartkit. A render pass produces drawing commands, and the WASM crate executes them on a Canvas 2D context. From your page to the canvas Your page → kestrel-loom.js kestrel-loom.js → kestrel-loom: WASM façade kestrel-chartkit → kestrel-loom: on_bar kestrel-loom → kestrel-loom-wasm: RenderCommands kestrel-loom-wasm → <canvas> WASM façade on_bar RenderCommands Your page – candles, mouse, touch Your page candles, mouse, touch kestrel-loom.js – wrapper you embed kestrel-loom.js wrapper you embed kestrel-loom – Rust core, no browser API kestrel-loom Rust core, no browser API kestrel-chartkit – indicator math kestrel-chartkit indicator math kestrel-loom-wasm – Canvas 2D execution kestrel-loom-wasm Canvas 2D execution <canvas> – the chart <canvas> the chart From your page to the canvas Your page hands candles and input to the JavaScript wrapper. Through the WebAssembly façade they reach the Rust core, which keeps chart state, viewport and tools and takes its indicators from kestrel-chartkit. A render pass produces drawing commands, and the WASM crate executes them on a Canvas 2D context. From your page to the canvas Your page → kestrel-loom.js kestrel-loom.js → kestrel-loom: WASM façade kestrel-chartkit → kestrel-loom: on_bar kestrel-loom → kestrel-loom-wasm: RenderCommands kestrel-loom-wasm → <canvas> WASM façade on_bar RenderCommands Your page – candles, mouse, touch Your page candles, mouse, touch kestrel-loom.js – wrapper you embed kestrel-loom.js wrapper you embed kestrel-loom – Rust core, no browser API kestrel-loom Rust core, no browser API kestrel-chartkit – indicator math kestrel-chartkit indicator math kestrel-loom-wasm – Canvas 2D execution kestrel-loom-wasm Canvas 2D execution <canvas> – the chart <canvas> the chart Architecture JavaScript API →
Quickstart Build the WASM package from the repository, load the wrapper and hand it a canvas. The documentation covers data, indicators, tools and the Rust core.
01 Clone the repository and run ./build-wasm.sh; it writes the package to pkg/. 02 Serve js/ and pkg/ next to each other and import createChart. 03 Set candles in Unix seconds, fit the view, add indicators and tools. chart.js JavaScriptCopy import { createChart } from './js/kestrel-loom.js' ; const chart = await createChart (canvas , { timeframe : '5m' }); chart . data .set (candles); // { time, o, h, l, c, v } chart . view .fit (); chart . indicators .add ( 'rsi' );