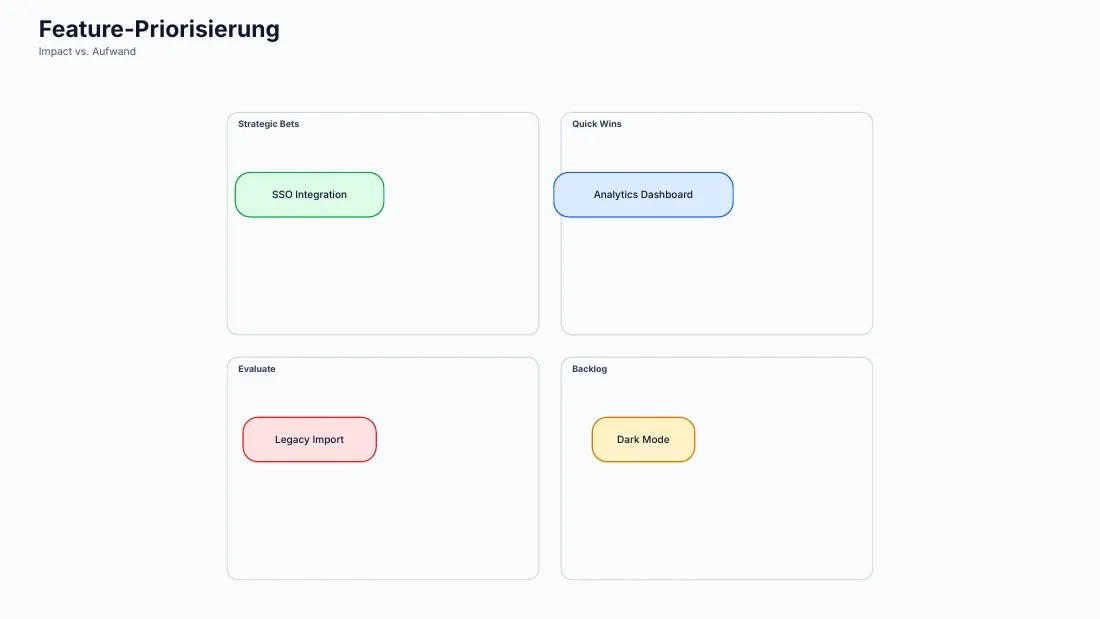
Diagram: quadrant
Impact versus effort as a scatter plot with named quadrants: chartlet draws the dividing lines and the area names.
Diagram: quadrant
examples/diagrams/quadrant.json{
"schemaVersion": 1,
"type": "scatter",
"title": "Feature-Priorisierung",
"source": "Impact vs. Aufwand, Schätzung 1–10",
"scatter": {
"points": [
{
"x": 7,
"y": 8,
"label": "Analytics Dashboard"
},
{
"x": 3,
"y": 8,
"label": "SSO Integration"
},
{
"x": 7,
"y": 3,
"label": "Dark Mode"
},
{
"x": 2,
"y": 2,
"label": "Legacy Import"
}
],
"xRange": [
0,
10
],
"yRange": [
0,
10
],
"xTitle": "Aufwand",
"yTitle": "Impact",
"quadrants": {
"x": 5,
"y": 5,
"labels": {
"topLeft": "Schnelle Erfolge",
"topRight": "Großprojekte",
"bottomLeft": "Lückenfüller",
"bottomRight": "Vermeiden"
}
}
}
}